
If you have an area that you think may be suitable for the establishment of a wind turbine, but have no historical data on average wind velocities, arboreal help may be at hand!
Just for reference, we all remember from school the (rather quaint) Beaufort scale of wind speed. The following chart gives Beaufort scale type descriptions but with wind speeds in Mph
0 – 1 Smoke rises vertically.
2 – 3 Direction of wind shown by smoke drift, but not by wind vanes.
4 – 7 Wind felt on face; leaves rustle; ordinary wind vane moved by wind.
8 – 12 Leaves and twigs in constant motion; wind extends a light flag.
13 – 18 Raises dust, loose paper; small branches are moved.
19 – 24 Small trees in leaf begin to sway; crested wavelets form on inland waters.
25 – 31 Large branches in motion; whistling heard in power lines; umbrella use is difficult.
But that’s not a great deal of help if you are a landowner wondering whether that unused field may be worth offering to a wind farm developer for the placement of one or more wind turbines or even if you are playing with the idea of installing one on your land for your own use. Records of past wind speeds are going to be the best indicator of future wind speeds . But are there any accurate records? Today there may be a good wind, but yesterday? last week? last month, last yea?, and over the last 10 years?
Go hug a nearby tree! There may be historical data right in front of your eyes… using the Griggs Putnam Index of Deformity & Judging Wind Speeds On Site From Your Trees/Hedges.
This tree is telling you something….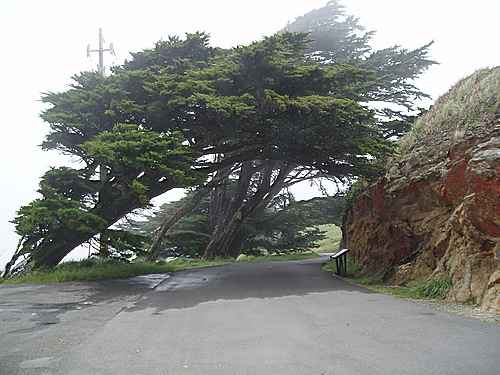
You may never have heard of the term ” Griggs-Putnam Index of Deformity ” – in simple terms, it relates to the shape of the trees or hedges on the land, that have been shaped by the wind over many years.
Also known as” Historical Wind Speed Indicator(s)”, and it’s a better localized judge of a proposed turbine site, that any wind map or on-line wind measuring tool. Looking at wind swept trees or low level black thorn hedges (more common in Northern Ireland), tells us several things in relation to the proposed turbine site. Namely- Wind Direction and Wind Speed. Heavily swept trees and hedges demonstrate the fact that the wind has been good for the last 20 years or more on this site.

Click on and consult the Giggs-Putnam chart below which sets out the categories of wind speed against representations of the tree/plant deformity:

There are expressions
T relating to the degree ansd types of deformity: flagging, brushing, throwing and carpeting. The first tree shows no deformity – it is symmetrical. As the average wind speed increases the tree is subject to greater deformity, from slight flagging through to complete flagging. As the average wind speed increases even further, trees are unable to grow vertically and can only survive close to the ground. Brushing occurs when small tree limbs are bent downward so the tree has a brushy appearance. Flagging is when large limbs bend downward and limbs which are upwind are shorter than limbs which are downwind. Throwing happens when the actual trunk of the tree curves downwind. Carpeting occurs when the wind is so strong that the tree trunk cannot rise up but instead grows along the ground.


We are contractor to supply government of Pakistan now Pakistan is interested to installed 100 MW wind turbines plant on turnkey basis.
so it is required your competitive prices with complete equipments and grantee.
with regards
Adamjee